StopLossThat indicator helps us to determine the stop loss levels or prices in terms of atr levels. It includes 4 (four) options which are 1-Don't Risk, 2-Low Risk, 3-High Risk, 4-Risk Lover their exploding rates are 1-2.4% , 2-3.9% , 3-6.7% , 4-16.7% in sort. It helps us to produce new methods to decreace our risk/reward ratio. It is ATR Trailing StopLoss indicator. The indicator is awesome in terms of comfortable. Thanks and waiting for your feedbacks.
在腳本中搜尋"Trailing stop"

MilleMachineHello traders,
I hereby present to you the second stage of my journey to finding a reliable, profitable trading strategy.
The "Millemachine" is based on the "Millebot", my previous published strategy. This means the backbone of the strategy is still the same: a trend following system. Instead of using a fixed TP and SL, a trailing stoploss is now used. To limit the losses when the trend weakens, the trailing stoploss automatically gets smaller, as it is based on the ATR.
A new utility is you can now easily switch between indicators on which the decision making is based. This allows the user to discover which indicators work best for entry, long/short switching and stoploss configuration.
The strategy has been proven to be very profitable in trending markets, but can suffer losses during ranging market. To make the system more robust, the strategy cannot solely rely on a trending system. Other systems must be added.
I believe that a good trading bot must consist of more than 4 different strategies, based on different systems. This is what I am currently working on.
My goal for publishing this strategy is to help other traders build their own. In my journey I found it difficult to find a good strategy that employs a decent risk management, which is truly essential for having good, consistent results. Also, a realistic commission needs to be defined to have a realistic performance prediction. This weighs on the profitability and therefore is often set at 0 by authors of other strategies, which I find misleading.
If you have found this strategy informative or useful, please leave a comment.
Greetings Michael

ATR Trading SetupThis simple script base on function of ATR Trailing Stop (aka SuperTrend) to plot Trading Setup on chart with detail as below:
1. Type of Average True Range (ATR)
+ The function calculate ATR may base on 1 of 3 type of Average: RMA, SMA, EMA
2. Trading Setup
2.1 Long setup
+ SuperTrend is upTrend
+ Entry Long at (or below) last value ATR Trailing Stop of Previous Trend (DownTrend)
+ Stop loss at first value ATR Trailing Stop of now Trend (upTrend)
+ Take profit at first value ATR Trailing Stop of Previous Trend (downTrend)
+ Move stop loss follow ATR Trailing Stop (green dot)
2.1 Short setup
+ SuperTrend is downTrend
+ Entry Short at (or above) last value ATR Trailing Stop of Previous Trend (upTrend)
+ Stop loss at first value ATR Trailing Stop of now Trend (downTrend)
+ Take profit at first value ATR Trailing Stop of Previous Trend (upTrend)
+ Move stop loss follow ATR Trailing Stop (red dot)

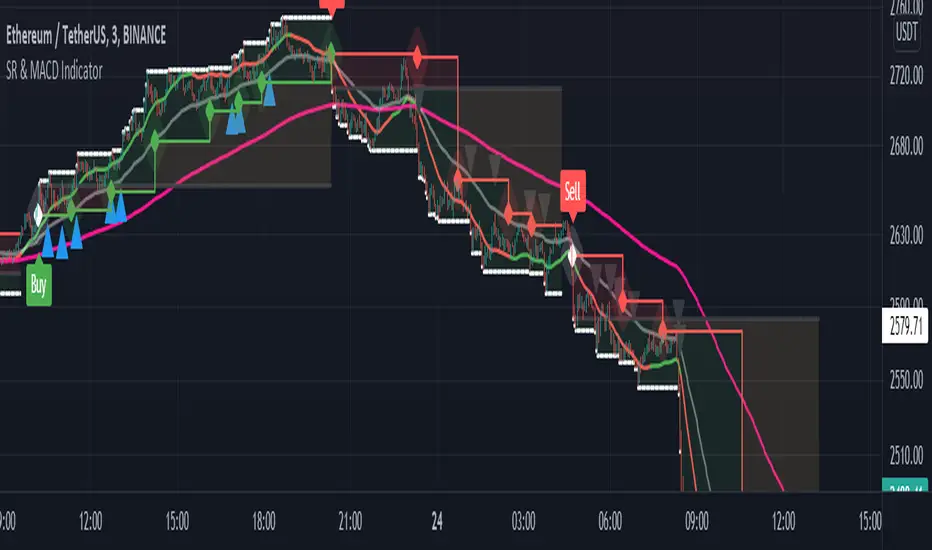
Support and Resistance with MACD IndicatorOriginal script from ©akpaswaniitk. I just added MACD to filter out bad trades and alert function so that we get notified whenever indicator gives us an entry signal. Most of the false breakout has been removed but the remaining ones only pop up during consolidation, so it's wait for the retest before entry. Works better in continuous market. Also look at the color of EMA for further confirmation, only focus on buy side when EMA is green and sell when EMA is red or when after the buy signal EMA changes color from red to green. These are the highly profitable setups I've found with this indicator.
Signals
Red or Green solid line with diamond are trailing stoploses
dotted black line is entry level
dotted white line is optimal exit
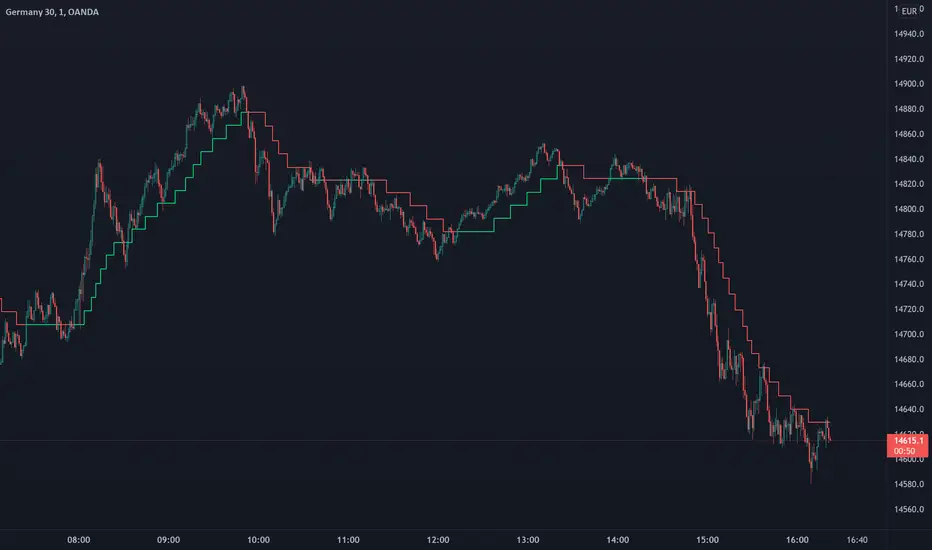
Trend Step - TrailingTrend Step - Trailing Stop is a moving average-based trailing stop that moves in pre-defined steps. In this way, the user can set the number of pips/points they want the trailing to move in relation to the movements in the average. You can also see it as trend steps. Every step represents the trend movement.
Usage
Use it as a trailing stop or as a trend direction tool.
Disclaimer: No financial advice, only for educational/entertainment purposes.
Swing Dream - PAINT BARS | MA | EMA | DMA | VWAP | TABLE | ADR %- Swing Dream -
Script created for breakout-swing traders, in the style of QullaMaggie * , Dan Zanger, Oliver Kell, and Stockbee.
The following indicators are used by most successful breakout-swing traders such as mentioned above.
(As published) it contains:
Painted Bars, also known as inside/outside candles. Used for candle analysis and to determine breakout pivots & levels. For instance; use it in different timeframes and seek formations (ex, 3-1-2). For further inspiration, study Rob Smith's The Strat .
MA, Simple Moving Averages (Basic levels = 10,20,50,200). Use this indicator to define resistance/support areas as well as the overall long/swing-term trend. In breakout strategies such as EP, Flags, etc this can be used for trailing stops; an example, post-breakout, let the price ride the 20ma before exiting your position.
EMA, Exponential Moving Averages with periods inspired by Qullamaggie (10,20,65). Use this on shorter timeframes (ex, 1h) and for the same principles as MAs.
VWAP, Volume-Weighted Average Price. As for the previous, utilize this as a level indicator to find areas of resistance/support. Good for swing-trading as it implies whenever holders are profitable or not.
DMA, Displaced Moving Average (Horizontal). Personally, I use this a lot. Works very well for trailing stops (post breakout) and "bounce" areas. Choose your own offset and period.
ADR%, Average Daily Range Percentage. Displayed in the table and used to define a symbol's volatility. A very good tool for Qullamaggie-style trading. Personally, I try to find setups with over 6% ADR. Basic definition; low ADR% = Increased chance of a symbol to move slower and in smaller ranges. A higher value equals the opposite.
Table. A table with basic symbol-related information. Could save you plenty of time whenever you scan or search for new swing setups. Looking to add more features here.
Why should you use this script? Well, instead of having tens of different indicators, use this script and combine everything together with EP, Flag, or breakout principles. Suited for every plan, and more efficient in my opinion.
View settings to turn on/off different indicators.
* If you're looking for an introduction and further explanation of how Qullamaggie uses mentioned indicators, I could recommend checking out his website, stream, or participation in "Chat With Traders".
At last, I want to credit: @jkcqld @neolao @TheScrutiniser
This Script will get updated and improved.
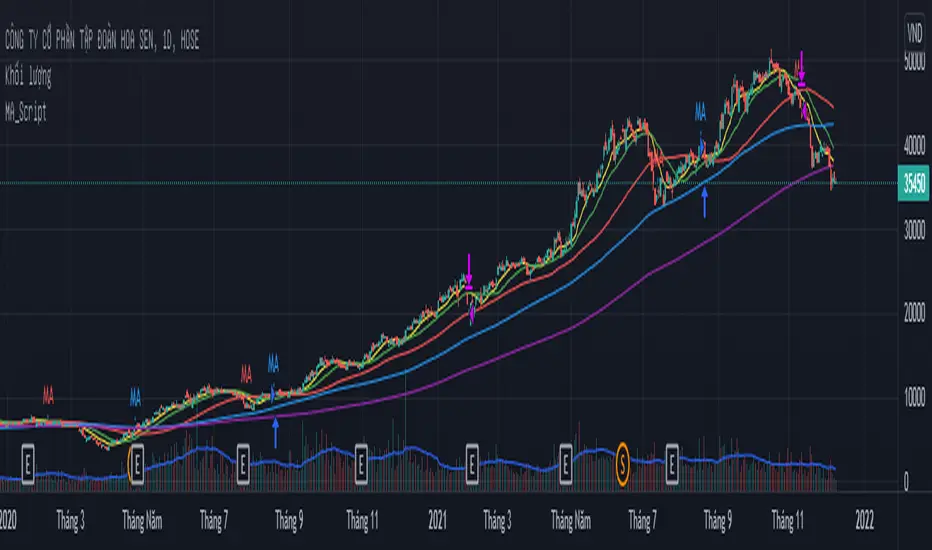
// TechFille006

MA_Script- Entry Point : base on MA20, MA50, MA100, MA200.
- Exit Point : base on stop loss, MA and trailing stop.
RSI StrategyThis RSI strategy is different than most in that it doesn't pick a buy signal based on the RSI rising above a specific number (usually 30). Instead, it creates a 14 day exponential moving average of the Relative Strength Index and uses the following two conditions together to trigger a buy:
Entry conditions:
Condition1: Rising of the RSI's moving average for (user defined) candles in a row
Condition 2: The RSI is < 70
The reasoning behind condition 1 is that we are trying to buy into a rising trend, the moving average helps to confirm the trend, whereas the RSI rising above a specific number (usually 30) gives us no real indication that the asset will increase and produces less wins overall. The reasoning behind condition 2 is to avoid buying at the top of a climb.
Exit conditions:
Condition 1: The RSI moving average is falling
Condition 2: Close < Trailing stop activation Level
Condition 3: We have at least (user defined) % profit
The reasoning behind sell condition 1 is a falling RSI moving average (down trend starting). The close has to be under the trailing stop activation level, if we've triggered the trailing stop, we want the trailing stop to do it's job and not exit the trade until the trailing stop takes us out. The reasoning behind condition 3 is to not exit without at least some profit (user defined).

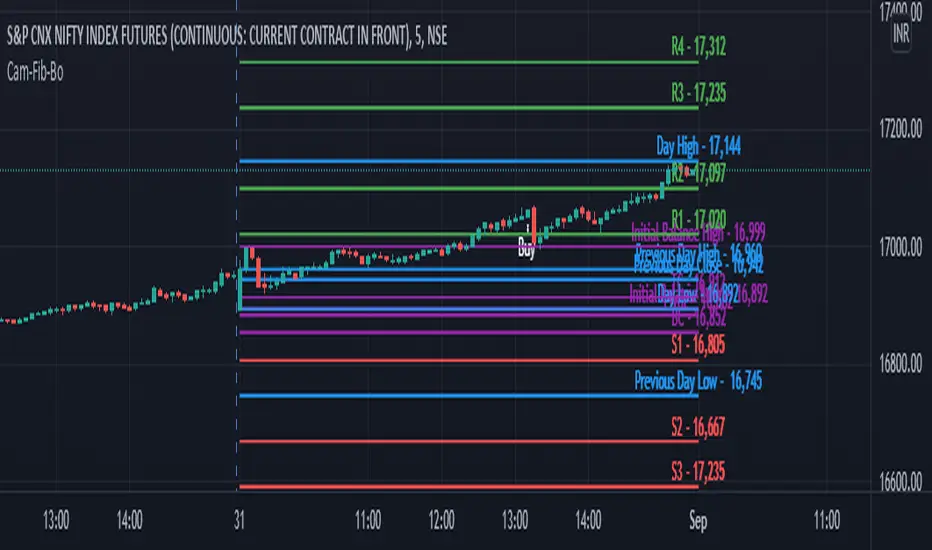
Camarilla Fibonachi Breakout Indicator with AlertsThis Script can be used for Intraday Only.
This Script will Plot the following Lines in the Chart
1. VWAP (Colour will be ploted as per the following condition)
VWAP Line will Plotted in Green if Open Price is Greater Than Close
VWAP Line will Plotted in Red if Open Price is Less Than Close
2. VWMA (VWMA Period used 14)
3. Atr Trailing Stoploss
(ATR Period 5, ATR Multiplier 2.5 is used to plot the Lines)
4. 15 Min High Low of the day will be plotted as dotted Purple lines
5. H4 as BuyAbove Level
6. H3 as Buy Stop Loss Level
7. H5 as Buy Target 1 Level
8. H6 as Buy Target 2 Level
9. H7 as Buy Target 3 Level
10. H8 as Buy Target 4 Level
11. H9 as Buy Bonus 1 Level
12. H10 as Buy Bonus 2 Level
13. H11 as Buy Bonus 3 Level
14. H12 as Buy Bonus 4 Level
15. L4 as Sell Below Level
16. L3 as Sell Stop Loss Level
17. L5 as Sell Target 1 Level
18. L6 as Sell Target 2 Level
19. L7 as Sell Target 3 Level
20. L8 as Sell Target 4 Level
21. L9 as Sell Bonus 1 Level
22. L10 as Sell Bonus 2 Level
23. L11 as Sell Bonus 3 Level
24. L12 as Sell Bonus 4 Level
This script will generate Buy signal on he following condition
1.Close Must be Greater than H4
if Calculate Inside Camarilla is Enabled then the Script will check whether Yesterdays H4 is Less than Todays H4
2.Close Must be Greater than VWAP
3.Volume Must be Greater Than 20 Period Simple Moveing Average
4.Buy Signal will be Displayed only Once for a Day.
This script will generate Sell signal on he following condition
1.Close Must be Less than L4
if Calculate Inside Camarilla is Enabled then the Script will check whether Yesterdays L4 is Less than Todays L4
2.Close Must be Less than VWAP
3.Volume Must be Greater Than 20 Period Simple Moveing Average
4.Sell Signal will be Displayed only Once for a Day.
and the Alert Message will be Generated for Buy and Sell
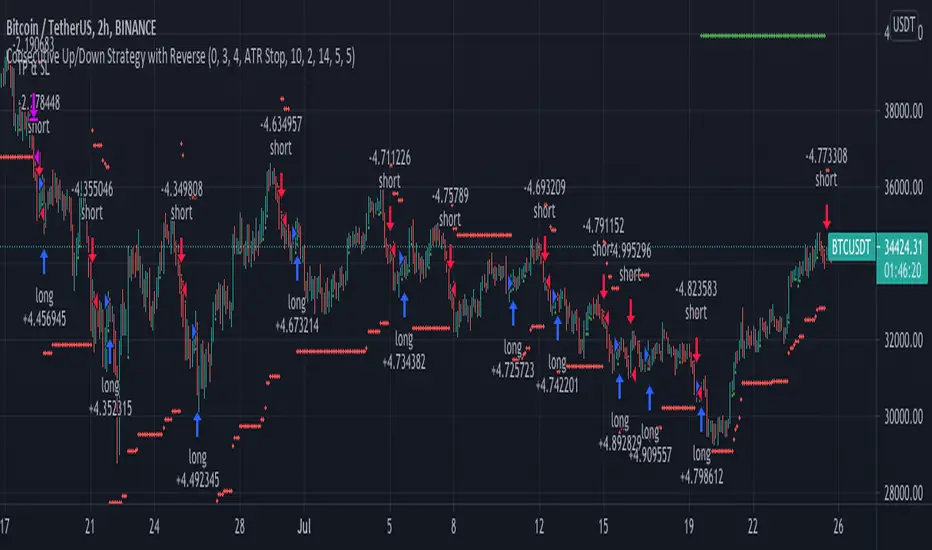
Consecutive Up/Down Strategy with Reverse and SLExtension of the built-in strategy by TradingView. The strategy buys after an X amount of
consecutive bullish bars and viceversa for selling. This logic can be reversed and a Stop Loss
with Take Profit can be added. There's also an option to adapt the SL into a Trailing Stop.
Supertrend with Percent Difference from CloseThis script improves the Supertrend indicator by displaying a label that shows the percent difference between the latest closing price & the Supertrend.
This comes in handy when one is using the Supertrend value as a stoploss level. For instance, one would like to have a maximum stop loss level of 8%. Instead of calculating how much percent the price is away from the Supertrend, one can look at the percent label & make an informed decision as to whether initiating a position would have favourable risk/reward or not.
Another utility would be selling into strength when one is using the Supertrend as a trailing stop loss. For instance, if the price is a certain percentage far away from the Supertrend, one may conclude that the price is now extended & either price correction or time correction would ensue, & decide to sell into strength.

Trend Surfers - Premium Breakout + AlertsTrend Surfers - Premium Breakout Strategy with Alerts
I am happy today to release the first free Trend Surfers complete Breakout Strategy!
The strategy includes:
Entry for Long and Short
Stoploss
Position Size
Exit Signal
Risk Management Feature
How the strategy works
This is a Trend Following strategy. The strategy will have drawdowns, but they will be way smaller than what you would go through with buy and old.
As a Trend Following strategy, we will buy on strength, when a breakout occurs. And sell on weakness.
The strategy includes a FIX Stoploss determined by an ATR multiple and a trailing Stoploss/Takeprofit also determined by an ATR multiple.
You can also manage your risk by entering the maximum % you are willing to risk on every trade. Additionally, there is an option to enter how many pairs you will be trading with the strategy. This will change your position size in order to make sure that you have enough funds to trade all your favorite pairs.
Use the strategy with alerts
This strategy is alert-ready. All you have to do is:
Go on a pair you would like to trade
Create an alert
Select the strategy as a Trigger
Wait for new orders to be sent to you
Every Entry (Long/Short) will include:
Market Entry (Enter position NOW!)
Stoploss price
Position Size
Leverage
* If you do not wish to use leverage, you can multiply the Position Size by the Leverage. But doing that, you might end up with a position greater than your equity. Trading on Futures is better in order to have accurate risk management.
Exit signals:
When you receive an exit signal, you need to close the position ASAP. If you want to keep your results as close as possible to the backtest results, you need to execute quickly and follow what the strategy is telling you.
Do not try to outsmart the strategy
Leave your emotion out of trading! If you trust the strategy, you will have way better returns than if you try to outsmart it. Follow each signal you receive even if it doesn't seem logical at the moment.
Become a machine that executes. Don't look at fundamentals. Follow the trend! Trust the strategy!
I hope you enjoy it!

(IK) Stoch-60-15This strategy uses 60 minute and 15 minute stochastic data to determine entry and exit; it only executes long trades. I've only used this on BTC/USD, but I imagine the concepts employed should hold for any ticker
The script builds a simple Stochastic indicator for the current timeframe, and it also plots a single stochastic line for a higher resolution time frame. I've found good results trading on 15 minutes with a 60 minute higher resolution.
We enter a trade if the higher resolution stochastic is in an uptrend, if the current resolution stochastic is in an uptrend, and if the current stochastic value is less than 50.
We exit a trade when the current stochastic value crosses below 80 or the trailing stop loss is hit.
Stop loss is calculated with the input value, Stop Loss Percent. This value represents the percent of capital you're willing to lose before exiting a trade. A stop loss percent of 0.050 means your trade will exit if it falls 5% from the highest high since entering a trade. You will have at least 95% of your original capital left. There is no option to change a trailing stop loss to a set stop loss (in order to keep the code as simple as possible), however, you can turn it off by setting Stop Loss Percent to 1.
I tried to keep the script itself lightweight and very easy to understand, so it's not very customizable in regards to input options. You can change stochastic data, as well as the trailing stop percentage. The script can be adjusted to other timeframes, however this requires a small change in the code (details in script comments). Changing just the "Higher Resolution" input will not produce expected results
My hope is that by keeping it lightweight and simple, it will be easier for you to adjust to your specific needs, or work into a larger strategy.

Ichimoku Kinkō HyōThe Ichimoku Kinko Hyo is an trading system developed by the late Goichi Hosoda (pen name "Ichimokusanjin") when he was the general manager of the business conditions department of Miyako Shinbun, the predecessor of the Tokyo Shimbun. Currently, it is a registered trademark of Economic Fluctuation Research Institute Co., Ltd., which is run by the bereaved family of Hosoda as a private research institute.
The Ichimoku Kinko Hyo is composed of time theory, price range theory (target price theory) and wave movement theory. Ichimoku means "At One Glace". The equilibrium table is famous for its span, but the first in the equilibrium table is the time relationship.
In the theory of time, the change date is the day after the number of periods classified into the basic numerical value such as 9, 17, 26, etc., the equal numerical value that takes the number of periods of the past wave motion, and the habit numerical value that appears for each issue is there. The market is based on the idea that the buying and selling equilibrium will move in the wrong direction. Another feature is that time is emphasized in order to estimate when changes will occur.
In the price range theory, there are E・V・N・NT calculated values and multiple values of 4 to 8E as target values. In addition, in order to determine the momentum and direction of the market, we will consider other price ranges and ying and yang numbers.
If the calculated value is realized on the change date calculated by each numerical value, the market price is likely to reverse.
転換線 (Tenkansen) (Conversion Line) = (highest price in the past 9 periods + lowest price) ÷ 2
基準線 (Kijunsen) (Base Line) = (highest price in the past 26 periods + lowest price) ÷ 2
It represents Support/Resistance for 16 bars. It is a 50% Fibonacci Retracement. The Kijun sen is knows as the "container" of the trend. It is prefect to use as an initial stop and/or trailing stop.
先行スパン1 (Senkou span 1) (Lagging Span 1) = {(conversion value + reference value) ÷ 2} 25 periods ahead (26 periods ahead including the current day, that is)
先行スパン2 (Senkou span 2) (Lagging Span 2) = {(highest price in the past 52 periods + lowest price) ÷ 2} 25 periods ahead (26 periods ahead including the current day, that is)
遅行スパン (Chikou span) (Lagging Span) = (current candle closing price) plotted 26 periods before (that is, including the current day) 25 periods ago
It is the only Ichimoku indicator that uses the closing price. It is used for momentum of the trend.
The area surrounded by the two lagging span lines is called a cloud. This is the foundation of the system. It determines the sentiment (Bull/Bear) for the insrument. If price is above the cloud, the instrument is bullish. If price is below the cloud, the instrument is bearish.
-
The wave theory of the Ichimoku Kinko Hyo has the following waves.
All about the rising market. If it is the falling market, the opposite is true.
I wave rise one market price.
V wave the market price that raises and lowers.
N wave the market price for raising, lowering, and raising.
P wave the high price depreciates and the low price rises with the passage of time. Leave either.
Y wave the high price rises and the low price falls with the passage of time. Leave either.
S wave A market in which the lowered market rebounds and rises at the previous high level.
There are the above 6 types but the basis of the Ichimoku Kinko Hyo is the N wave of 3 waves.
In Elliott wave theory and similar theories, basically there are 5 waves but 5 waves are a series of 2 and 3 waves N, 3 for 7 waves, 4 for 9 waves and so on.
Even if it keep continuing, it will be based on N wave. In addition, since the P wave and the Y wave are separated from each other, they can be seen as N waves from a large perspective.
-
There are basic E・V・N・NT calculated values and several other calculation methods for the Ichimoku Kinko Hyo. It is the only calculated value that gives a concrete value in the Ichimoku Kinko Hyo, which is difficult to understand, but since we focus only on the price difference and do not consider the supply and demand, it is forbidden to stick to the calculated value alone.
(The calculation method of the following five calculated values is based on the rising market price, which is raised from the low price A to the high price B and lowered from the high price B to the low price C. Therefore, the low price C is higher than the low price A)
E calculated value The amount of increase from the low price A to the high price B is added to the high price B. = B + (BA)
V calculated value Adds the amount of decline from the high price B to the low price C to the high price B. = B + (BC)
N calculated value The amount of increase from the low price A to the high price B is added to the low price C. = C + (BA)
NT calculated value Adds the amount of increase from the low price A to the low price C to the low price C. = C + (CA)
4E calculated value (four-layer double / quadruple value) Adds three times the amount of increase from the low price A to the high price B to the high price B. = B + 3 × (BA)
Calculated value of P wave The upper price is devalued and the lower price is rounded up, and the price range of both is the same.
Calculated value of Y wave The upper price is rounded up and the lower price is rounded down, and the price range of both is the same.

MA, MATR, ChEx | All in One - 4CR CUPIn trade position setup, we always need to determine the market structure and manage the position sizing in a short period of decision time. Indicators such as moving average, initial stop loss and trailing stop loss are always helpful.
This indicator put all these handy tools into a single toolkit, which includes the following price action and risk management indicators:
MA - Moving Average
MATR - Moving Average less Average True Range
ChEx - Chandelier Exit
This script further enhances the setting so that you can easily customize the indicators.
For both the Moving Averages and the Moving Average less Average True Range , you can pick a type of moving average which suits your analysis style from a list of commonly used moving average formulations: namely, EMA , HMA , RMA, SMA and WMA , where EMA is selected as default.
The Moving Average less Average True Range , MATR, is usually applied as a reference to set the initial stop loss whenever opening a new position.
The abbreviation, MATR, is picked, so that this can serve as a handy reminder of a very good trading framework as elaborates as below:
M – Market Structure
A – Area of Value
T – Trigger
R – Risk Management (aka. Exit Strategy)

CHOP Zone Entry Strategy + DMI/PSAR ExitThis is a Strategy with associated visual indicators and Long/Short and Reverse/Close Position Alerts for the Choppiness Index (CHOP) . It is used to determine if the market is choppy (trading sideways) or not choppy (trading within a trend in either direction). CHOP is not directional, so a DMI script was ported into this strategy to allow for trend confirmation and direction determination; it consists of an Average Directional Index (ADX) , Plus Directional Indicator (+DI) and Minus Directional Indicator (-DI) . In addition, a Parabolic SAR is also included to act as a trailing stop during any strong trends.
Development Notes
---------------------------
This indicator, and most of the descriptions below, were derived largely from the TradingView reference manual. Feedback and suggestions for improvement are more than welcome, as well are recommended Input settings and best practices for use.
www.tradingview.com
www.tradingview.com
www.tradingview.com
Recommend using the below DMI and PSAR indicators in conjunction with this script to fully visualize and understand how entry and exit conditions are chosen. Variable inputs should correlate between the scripts for uniformity and visual compatibility.
THANKS to LazyBear and his Momentum Squeeze script for helping me quickly develop a momentum state model for coloring the Chop line by trend.
Strategy Description
---------------------------
CHOP produces values that determine whether the market is choppy or trending . The closer the value is to 100 , the higher the choppiness levels , while the closer it is to 0 , the stronger the market is trending . Territories for both levels, and their associated upper and lower thresholds, are popularly defined using the Fibonacci Retracements, 61.8 and 38.2.
Basic Use
---------------------------
CHOP is often used to confirm the market condition to help you stay out of sideways markets and only enter when there is movement or imminent explosions. When readings are above the upper threshold, continued sideways movement may be expected, while readings below the lower threshold are typically indicative of a continuing trend. It is also used to anticipate upcoming trendiness changes, with the general belief that extended periods of consolidation (sideways movement) are followed by extended periods of strong, trending, directional movement, and vice versa.
One limitation in this index is that you must be cautious in deciding whether the range or trend will likely continue, or if it will reverse.
Confidence in price action and trend is higher when two or more indicators are in agreement -- while this strategy combines CHOP with both DMI and PSAR, we would still recommend pairing with other indicators to determine entry or exit trade opportunities.
Recommend also choosing 'Once Per Bar Close' when creating alerts.
Inputs
---------------------------
Strategy Direction - an option to only trade Short, Long, Both, or only in the direction of the Trend (Follow Trend is the Default).
Sensitivity - an incremental variable to test whether the past n candles are in the same trend state before triggering a delayed long or short alert (1 is the Default). Can help filter out noise and reduces active alerts.
Show Chop Index - two visual styles are provided for user preference, a visible Chop line with a background overlay, or a compact column and label only view.
Chop Lookback Period - the time period to be used in calculating CHOP (14 is the Default).
Chop Offset - changing this number will move the CHOP either forwards or backwards relative to the current market (0 is the Default).
Smooth Chop Line and Length - if enabled, the entered time period will be used in calculating a smooth average of the index (Enabled and 4 are the Defaults).
Color Line to Trend Direction - toggles whether the index line is colored to visually depict the current trend direction (Enabled is the Default).
Color Background - toggles the visibility of a background color based on the index state (Enabled is the Default).
Enable DMI Option - if enabled, then entry will be confirmed by and dependent on the ADX Key Level, with any close or reversal confirmed by both ADX and +/-DI to determine whether there is a strong trend present or not (Enabled is the Default).
ADX Smoothing - the time period to be used in calculating the ADX which has a smoothing component (14 is the Default).
DI Length - the time period to be used in calculating the DI (14 is the Default).
ADX Key Level - any trade with the ADX above the key level is a strong indicator that it is trending (23 to 25 is the suggested setting).
Enable PSAR Option - enables trailing stop loss orders (Enabled is the Default).
PSAR Start - the starting value for the Acceleration Force (0.015 is our chosen Default, 0.02 is more common).
PSAR Increment - the increment in which the Acceleration Force will move (0.001 is our chosen Default, 0.02 is more common).
PSAR Max Value - the maximum value of the Acceleration Factor (0.2 is the Default).
Color Candles Option - an option to transpose the CHOP condition levels to the main candle bars. Note that the outer red and green border will still be distinguished by whether each individual candle is bearish or bullish during the specified timeframe.
Note too that if both DMI and PSAR are deselected, then close determinations will default to a CHOP reversal strategy (e.g., close long when below 38.2 and close short when above 61.8). Though if either DMI or PSAR are enabled, then the CHOP reversal for close determination will automatically be disabled.
Indicator Visuals
---------------------------
For the candle colors, black indicates tight chop (45 to 55), yellow is loose chop (38.2 to 45 and 55 to 61.8), dark purple is trending down (< 38.2), and dark blue is trending up (> 61.8).
The background color has additional shades to differentiate a wider range of more levels…
• < 30 is dark purple
• 30 to 38.2 is purple
• 38.2 to 45 is light purple
• 45 to 55 is black
• 55 to 61.8 is light blue
• 61.8 to 70 is blue
• > 70 is dark blue
Long, Short, Close, and Reverse labels are plotted on the Chop line, which itself can be colored based on the trend. The chop line can also be hidden for a clean and compact, columnar view, which is my preferred option (see example image below).
Visual cues are intended to improve analysis and decrease interpretation time during trading, as well as to aid in understanding the purpose of this strategy and how its inclusion can benefit a comprehensive trading plan.
DMI and Trend Strength
---------------------------
To analyze trend strength, the focus should be on the ADX line and not the +DI or -DI lines. An ADX reading above 25 indicates a strong trend , while a reading below 20 indicates a weak or non-existent trend . A reading between those two values would be considered indeterminable. Though what is truly a strong trend or a weak trend depends on the financial instrument being examined; historical analysis can assist in determining appropriate values.
DMI exits trade when ADX is below the user selected key level (e.g., default is 25) and when the +/- DI lines cross (e.g., -DI > +DI exits long position and +DI > -DI exits short position).
PSAR and Trailing Stop
---------------------------
PSAR is a time and price based indicator that excels at measuring direction and duration, though not the actual strength of a trend, which is why we use this in conjunction with DMI. It is also included in this script as a trailing stop option to maximize gains during strong trends and to mitigate any false ADX strengthening signals.
This creates a parabola that is located below the candle during a Bullish trend and above during a Bearish trend. A buy or reversal is signaled when the price crosses above or below the Parabolic SAR.
Long/Short Entry
---------------------------
1. CHOP must be over 61.8 (long) or under 38.2 (short).
2. If DMI is enabled, then the ADX signal line must be above the user selected Key Level (default is 25).
3. If Sensitivity is selected, then that past candle must meet the criteria in step 1, as well as all the intermediate candles in between.
4. If "Follow Trend" is selected and PSAR is enabled, then a long position can only open when the momentum and PSAR are in an uptrend, or short when both are in a downtrend, to include all intermediate candles if the Sensitivity option is set on a past candle.
Close/Reverse
---------------------------
1. If DMI is enabled, then a close flag will be raised when the ADX signal drops below the Key Level (of 25), and -DI crosses over +DI (if long), or +DI crosses over -DI (if short).
2. If PSAR is enabled, then a close flag will be raised when the current trend state is opposite the last state.
3. If both DMI and PSAR are disabled, then a close flag will be raised if the Chop line drops under 38.2 (if long) or goes over 61.8 (if short).
4. If a Long or Short Entry is triggered on the same candle as any of the above close flags, then the position will be reversed, else the position will be closed.
Strategy Alerts
---------------------------
1. Long Entry
2. Short Entry
3. Reverse
4. Close
The provided backtest result is based on a position sizing of 10% equity with 100k initial capital. When testing SPX, disabling the DMI performed the best, but EURUSD performed poorly without it enabled, and TSLA had a small reduction in net profit. Timeframe likewise differed between commodities with TSLA performing best at 30M, SPX at 15M, and EURUSD at 4H. I do not plan on using this as a standalone strategy, but I also was expecting better results with the inclusion of EMI and PSAR to compliment the CHOP. Key elements of this script will likely be included in future, more holistic strategies.
Disclaimer
---------------------------
Past performance may not be indicative of future results. Due to various factors, including changing market conditions, the strategy may no longer perform as well as in historical backtesting. This post and the script are not intended to provide any financial advice. Trade at your own risk.
No known repainting, though there may be if an offset is introduced in the Inputs. I did my best not to code any other variables that repaint, but cannot fully attest to this fact.

MACD+ Strategy [SystemAlpha]This is a strategy based on MACD Oscillator . Instead of using just the normal crossovers, we use trend filters, trailing stop loss and take profit targets. This strategy was developed for crypto, forex and stocks on daily timeframe but feel free to experiment on 15 minutes or higher using heikin ashi or normal candles
In this strategy you have a choice of:
Trend Filters:
- Average Directional Index ( ADX ) – buy when price is trend is up and sell when trend is down.
- Moving Average (MA) – buy when price close above the defined moving average and sell when price close below moving average
- Parabolic SAR – buy when SAR is above price is above price and sell when SAR is below price.
- All - Use ADX , MA and SAR as filters
For MA Filter , you can use the “TF MA Type” and "TF MA Period" parameter to select Simple or Exponential Moving Average and length.
Stop Loss:
- Average True Range (ATR) – ATR % stop as trailing stop loss.
- Parabolic SAR ( SAR ) – Parabolic SAR adapted as trailing stop loss.
For ATR , you can use the “ATR Trailing Stop Multiplier” parameter to set an initial offset for trailing stop loss.
Take Profit Target:
- Average True Range (ATR) – ATR % stop as trailing stop loss.
- Standard % – Percent as target profit
For ATR , you can use the “ATR Take Profit Multiplier” parameter to set an initial offset for trailing stop loss.
Additional feature include:
- Regular and Hidden Divergence display and alerts
STRATEGY ONLY:
- Set back test date range
- Set trade direction - Long, Short or Both
- Use timed exit - Select method and bars
- Method 1: Exit after specified number of bars.
- Method 2: Exit after specified number of bars, ONLY if position is currently profitable.
- Method 3: Exit after specified number of bars, ONLY if position is currently losing.
TradingView Links:
Alerts:
MACD:
How to use:
1. Apply the script by browsing through Indicators --> Invite-Only scripts and select the indicator
2. Once loaded, click the gear (settings) button to select/adjust the parameters based on your preference.
3. Wait for the next BUY or SELL signal to enter the trade!
Disclaimer:
The indicator and signals generated do not constitute investment advice; are provided solely for informational purposes and therefore is not an offer to buy or sell a security; are not warranted to be correct, complete or accurate; and are subject to change without notice.

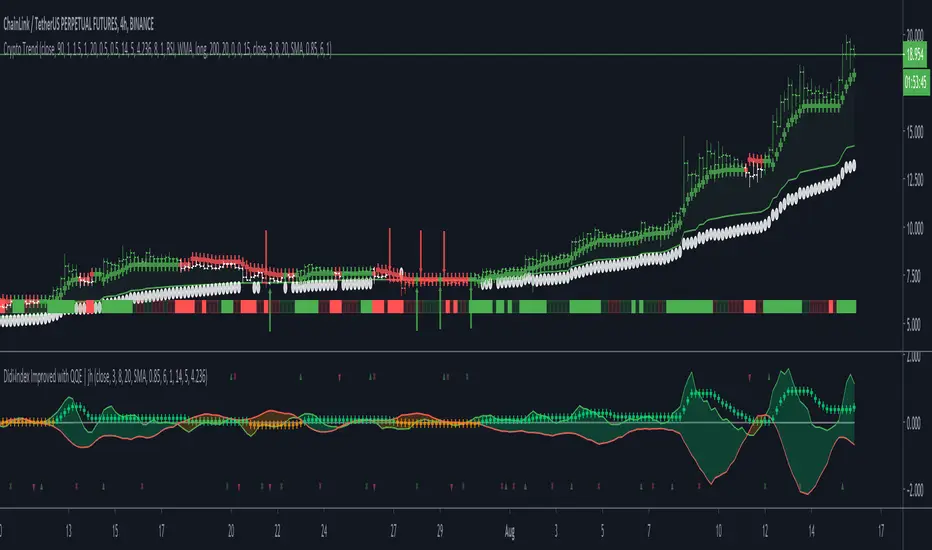
Crypto TrendThis indicator is based off of the Trend Follower system put together by jiehonglim:
This is a trend following system that combines 3 indicators which provide different functionalities, also a concept conceived by VP's No Nonsense FX / NNFX method. I’m primarily modifying this system for Crypto trading (mostly leveraged Crypto Futures). Suggestions/requests welcome.
New Features:
Added position inputs that will generate position labels
For leverage trading, position inputs will calculate your percentage-based stop loss given your entry, leverage and liquidation price
Added optional horizontal line plots for entry, stop loss, 50% take profit and 100% profit levels.
Added non-plotted Didi calculations for alert condition triggers
Added long and short alerts
These alerts will trigger for any of the 3 following conditions:
Baseline cross with volume confirmation
Didi two line cross with volume confirmation
Didi continuation with volume confirmation
1. Baseline
The main baseline filter is an indicator called Modular Filter created by Alex Grover
- www.tradingview.com
- Alex Grover - Modular Filter
-------
That's the moving average like baseline following price, filtering long and short trends and providing entry signals when the price crosses the baseline.
Entry signal indicated with arrows.
2. Volume / Volatility , I will called it Trend Strength
The next indicator is commonly known as ASH, Absolute Strength Histogram.
This indicator was shared by VP as a two line cross trend confirmation indicator, however I discovered an interesting property when I modified the calculation of the histogram.
- Alex Grover Absolute Strength
-------
My modification and other info here
- Absolute Strength Histogram v2
-------
I simplified the display of the trend strength by plotting squares at the bottom of the chart.
- Lighted Squares shows strength
- Dimmed Squares shows weakness
3. Second Confirmation / Exits / Trailing Stop
Finally the last indicator is my usage of QQE (Qualitative Quantitative Estimation), demonstrated in my QQE Trailing Line Indicator
- QQE Trailing Line for Trailing Stop
-------
Three usages of this amazing indicator, serving as :
- Second trend confirmation
- Exit signal when price crosses the trailing line
- Trailing stop when you scaled out the second trade
This indicator is plotted with crosses.
4. Position Calculator
For non-leveraged trades, set leverage to 1 and liquidation to 0
Fill out the rest of the position field to get labels that will tell you:
Your stop loss given your acceptable percentage of loss for your risk. So, for example if your actual investment is $200 and you’re trading on 20X leverage, you’d like to know what price would have to drop to for you to lose 15% of your $200 risk. This is what the position calculator is doing for you.
Your 50% take profit point
Your 100% take profit point
Check the “Show Position Lines” to plot horizontal lines for entry, stop loss, 50% TP and 100%TP
Alerts
You just get a Long Alert or Short Alert option. This was for two reasons, the first and most important was to reduce the number of alerts needed for this system to get maximum coverage. The second was just to keep things simple. Get an alert for your desired direction for any interesting signal and then check the chart manually to determine if a viable entry has presented itself. The three alert conditions are:
Main trend indicator, baseline cross with volume confirmation
Didi two line cross entry with volume confirmation
Didi continuation signal with volume confirmation
Additional plots and information
Bar Color
- Green for longs, Red for shorts, White when the baseline direction conflicts with the QQE trailing line direction
- When it's white, it's usually ranging and not trending, ASH will also keep you off ranging periods.
-------
ATR Filter
- White circles along the baseline, they will show up if the price has moved more than one ATR from the baseline
- The default allowance is 1 ATR.
-------
The previous and current ATR value
- Label on the right side of the chart showing the previous and current value of ATR
Trend trader StrategyFirst I would like to thank to @JustUncleL since this strategy started from one of his scalper strategies
This strategy can be adapted to all time charts .
First it has the session where we want to trade, for this example I choosed the EURUSD so I only take in consideration london/neywork session.
Its made from 3 EMA :
normal
slow
ultra slow
It has has the capacity to use HA candles into consideration if its needed.
At the same time we have a price channel made from faster MAs, that act like a bollinger band .
Together with all of them, we establish which trend we have if its uptrend or downtrend
Then we check the candles if they are below or above the MA , and based on the condition if they crossed recently we can suggest if its a buy or a long condition
At the same time we have 2 options of stop conditions:
Through a trailing stop made from ATR or % based
And second, a SL/TP made from pip points or % based.
For this example I used % based.
Let me know what you think about it, and if you found some nice settings for it. So far I only adapted to EURUSD 1 min time.

[CP]ATR Triple Stop Loss LevelsATR based Triple Stop Loss levels that are plotted on the chart (like moving averages!).
With ATR Levels plotted on the price chart itself, you can better set your volatility based trailing Stop Loss.
Also helps to define the SL when making an entry into a stock.
Note:
This indicator is supposed to be used on Daily and Weekly Charts.
For other timeframes you would need to tweek the default parameters.

EMA 5/10/21 SMA 50/100/200The Script is mixture of both EMAs and SMAs. EMA 5/10/21 are powerful indicators for short term providing more weightage to the recent prices. SMA 50/100/200 provide the long term view.
5 Day EMA: This is a sign of strong momentum. It tracks the trend in the short term time frame. This is support in the strongest up trends. This line can only be used in low volatility trends with strong momentum. A break back above this line is a sign for me that an uptrend may be resuming. I primarily use it as an end of day trailing stop. It is rare that this line does not break intraday, even in the strongest trending markets.
• 10 day EMA: The 10 day EMA is a great moving average to use to keep you on the right side of the major market trend. It is usually the first line to be lost before any real trouble begins. It can be used as a standalone signal in some stocks and markets that tend to trend strongly in one direction for long periods.
• 21 day EMA: This is the intermediate term moving average. It is generally the last line of support in a volatile uptrend. To me, it is the inevitable reversion to the mean in a market when it finally pulls back after an extended trend.
• 50 day SMA: This is the line that strong leading stocks typically pull back to. This is usually the support level for strong uptrends. It is normal for uptrending markets to pull back to this line and find support. Most bull markets and uptrends will pull back to this level. It is generally a great “Buy the dip” level.
• 100 day SMA: This is the line that provides the support between the 50 day and the 200 day. If it does not hold as support, there is a high probability that the 200 day SMA is the next stop. This is the deeper pullback level in bull markets and uptrends. It usually presents a great risk/reward ratio in bull markets.
• 200 day SMA: Bulls like to buy dips when markets are trading above the 200 day moving average, while bears sell rallies short below it. Bears usually win below this line, as the 200 day becomes longer term resistance, and bulls buy pullbacks to the 200 day as long as the price stays above it. This line is one of the biggest signals in the market telling you which side to be on. Bull above, Bear below. Bad things happen to stocks and markets when this line is lost.

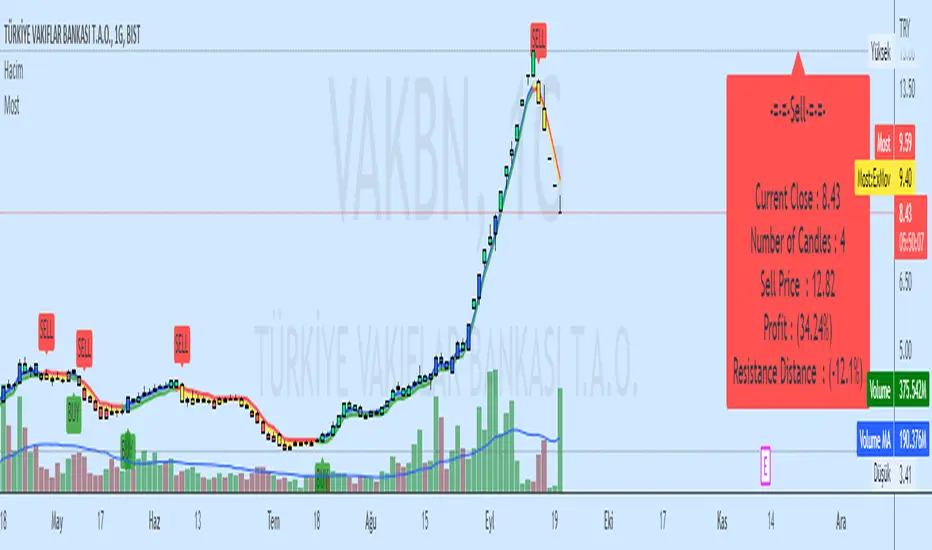
Moving Stop Loss (Most) by ceyhunATR is an indicator that has been removed and replaced with a moving average.Bar colors and infopanel have been added.
//Barcolor
Green = ExMov > Most and close > Most and low > Most
Blue = ExMov > Most and close > Most and low < Most
Red = Most > ExMov and close < Most and high < Most
Yellow = Most > ExMov and close < Most and high > Most
//It gives White color where there is deterioration.
//InfoPanel
Buy Price = Blue draws the circles at the purchase price.
Profit Long>20 = Risk level taken as a percentage, I got the highest 20%, you can determine as you wish.
Sell Price = Red draws the circles at the purchase price.
Profit Short>20 = Risk level taken as a percentage, I got the highest 20%, you can determine as you wish.
==Atr Original Code==
CDC ATR Trailing Stop V2.1 (2013)
==Most Code==
MOST by Anıl ÖZEKŞİ
Barcolor
Barcolor
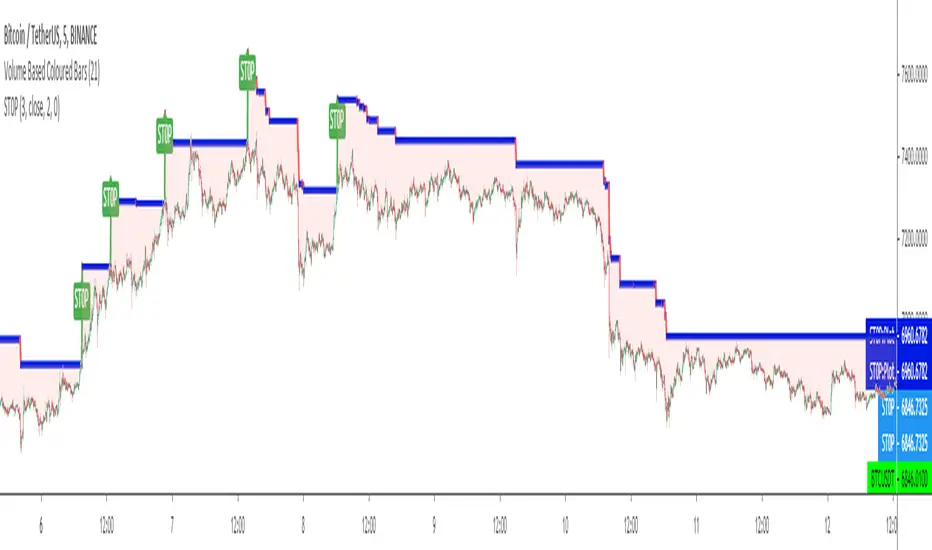
ST0PST0P is a kind of a TRAILING STOP LOSS INDICATOR in which users can set up LONG or SHORT trade versions and also can set up a STOP LOSS level by percent % or unit difference.
It tries to solve the problem of stop loss indicators' default BUY or SELL settings and non adjustable stop levels of % and difference change in price levels.
(Will try to make updates to add user defined start bars.)
Kıvanç Özbilgiç